Contact us if you want to know more about our tools and trainings.
CaroPlan – A Strategic Forest Planning Tool Powered by Operational Data
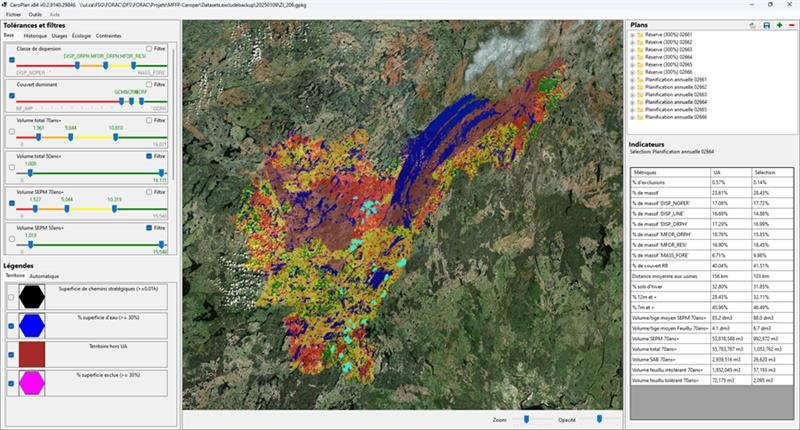
CaroPlan is an interactive tool developed by the FORAC Research Consortium in collaboration with Quebec’s Ministry of Natural Resources and Forests (MRNF). Its mission is to transform strategic forest planning by fully integrating operational characterization data (CAROPER). The goal is to bridge the gap between theoretical forest potential and on-the-ground realities, providing a better understanding of the operational discrepancies that affect long-term planning.
Developed through an agile, two-year process, CaroPlan allows users—forest planners, managers, trainers, and decision-makers—to visualize forest territory through 100-hectare hexagonal units, and easily consult key economic, social, and environmental indicators. It serves as a powerful analytical tool to identify potential intervention zones, generate territorial profiles, compare supply scenarios, and automatically generate plans that align with sustainability goals.
With its user-friendly and dynamic interface, CaroPlan supports the creation, analysis, and comparison of strategic scenarios. Beyond daily operational support, it also acts as an educational platform, raising awareness of the complex challenges of sustainable forest management among new professionals.
With CaroPlan, Quebec is equipped with a state-of-the-art tool to promote responsible, data-driven forest management. This first prototype version is ready for pilot deployment and paves the way for a future phase including optimization models and long-term impact projections.
2015-2022
Developed by Rémy Huot, Edith Brotherton and Étienne Pilon in collaboration with FQCF.
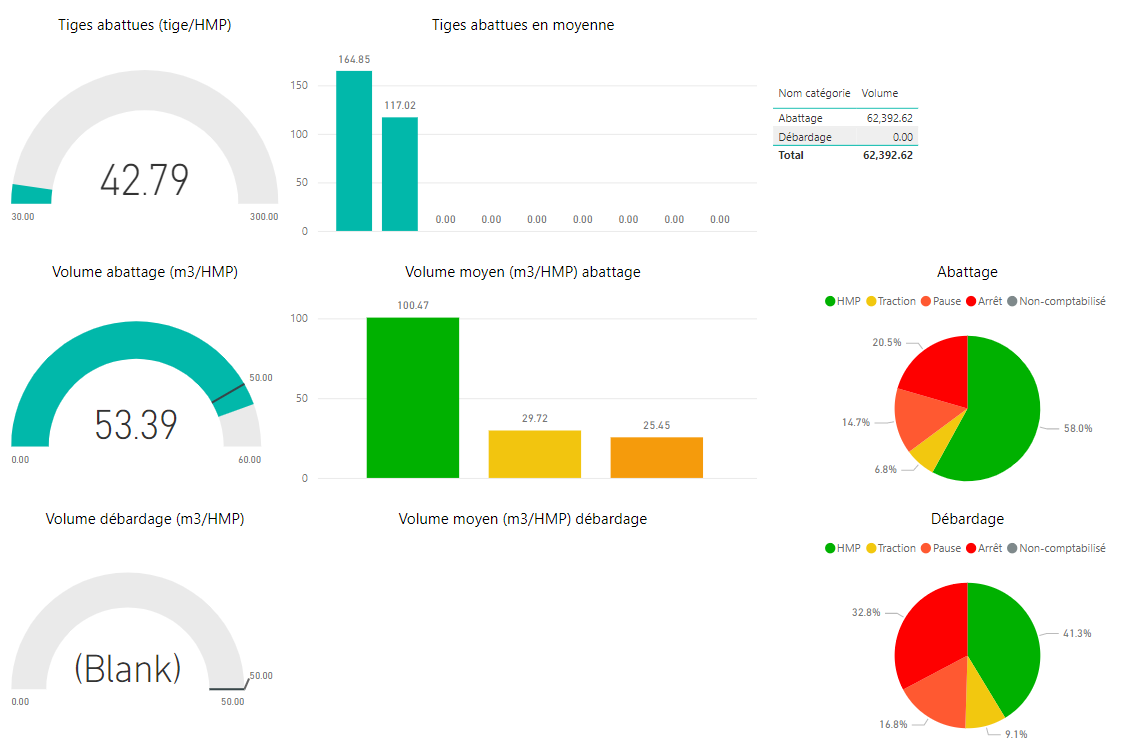
TBEF is a flexible dashboard that allows you to monitor the performance of harvesting or silvicultural work teams. Data comes from multiple sources and is aggregated according to a customizable configuration. Several types of data are supported and integrated into the dashboard:
- Machine production time data
- Volume data from machine heads
- Fuel consumption data
- Team schedule data
- Data on times and distances traveled for silvicultural work
- Machine maintenance data
The data is aggregated into a Microsoft Access file using the Dashboard Editor and the results are viewable in a PowerBI file. TBEF is also currently being integrated into the ForacID platform (see the Web plateforms section).
2019, Developped by Philippe Marier
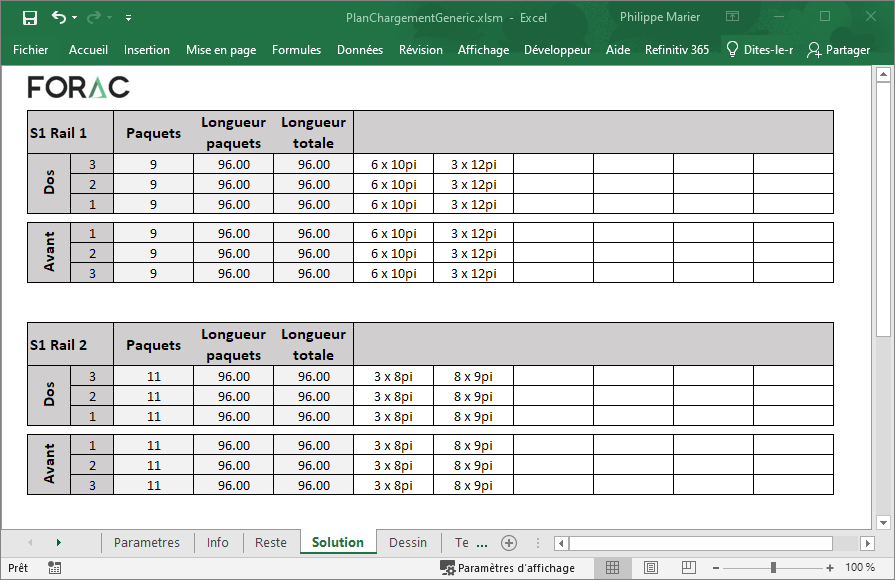
The kiln loading optimizer is a small utility allowing to maximize the number of linear feet loaded in kilns considering an available inventory of wet lumber. It eliminates the need to manually consider the different possible combinations of length arrangements to best utilize the capacity of the dryers. The Excel interface makes it possible to enter the parameters to be considered for loading, in particular the length of the dryers, the weighting of the optimization criteria and the number of products (bundles) of each length:
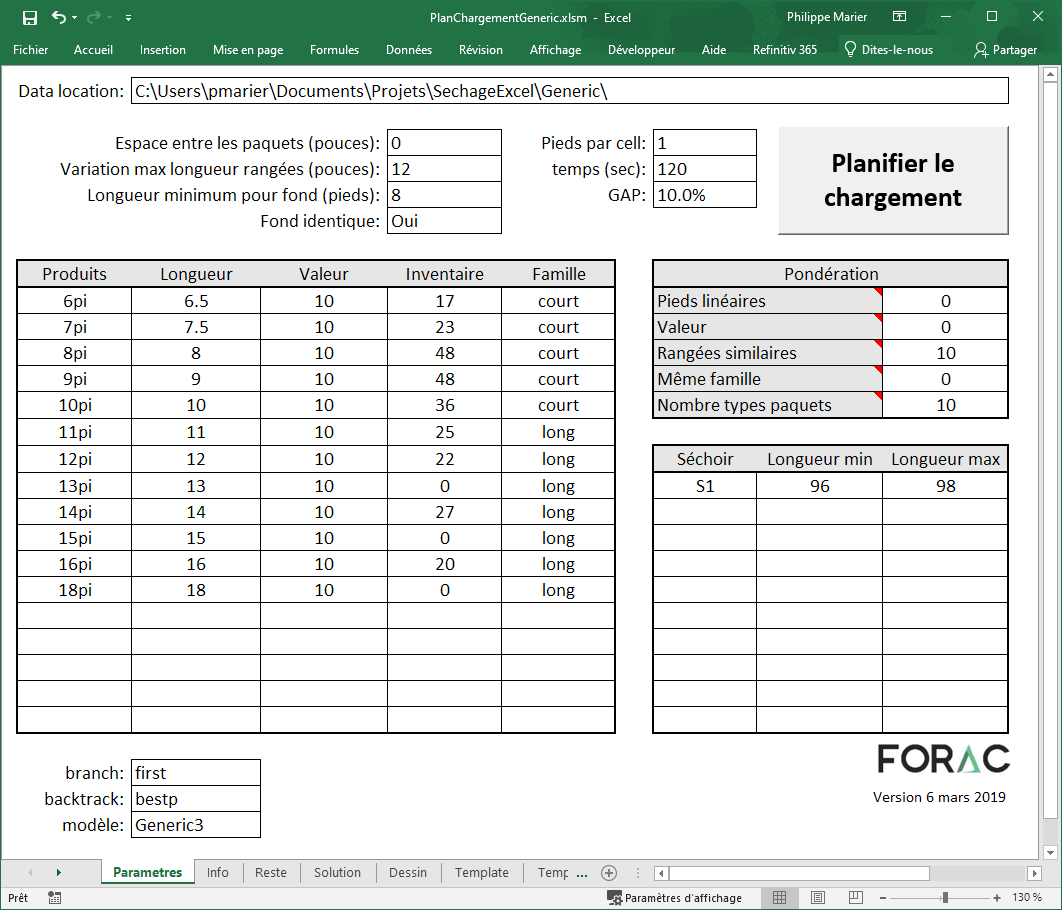
Five criteria make it possible to align the search for the best solution:
1) maximize the use of dryer capacity;
2) maximize the value of the dried products;
3) get as many similar rows as possible;
4) group the products of the same family in the same dryer;
5) minimize the number of different bundles.
The open source solver GLPK is used to optimize the mathematical model for planning the loading of dryers. Its use is completely hidden from the user who enters the parameters and retrieves the solution in the same Excel spreadsheet.
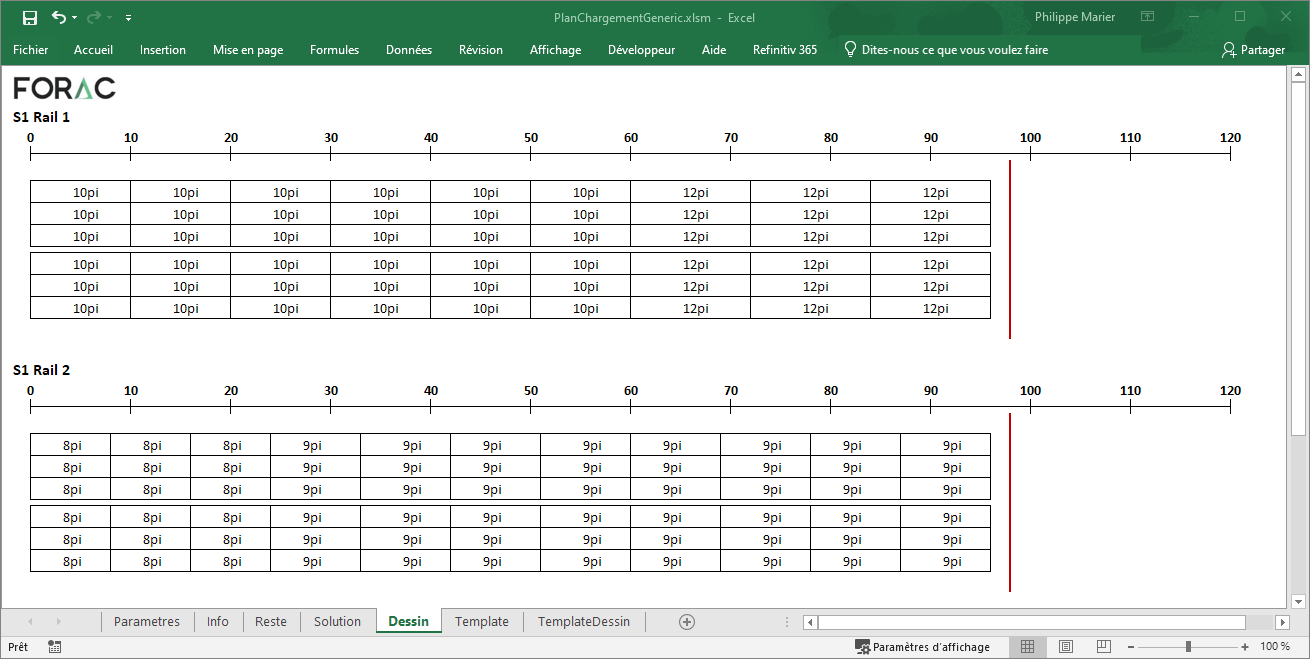
The solution is obtained after a few seconds in the form of a visual or tabular plan:
2021-2022
Developed by Alexandre Morneau in collaboration with Myriam Delmaire and Eric R. Labelle.
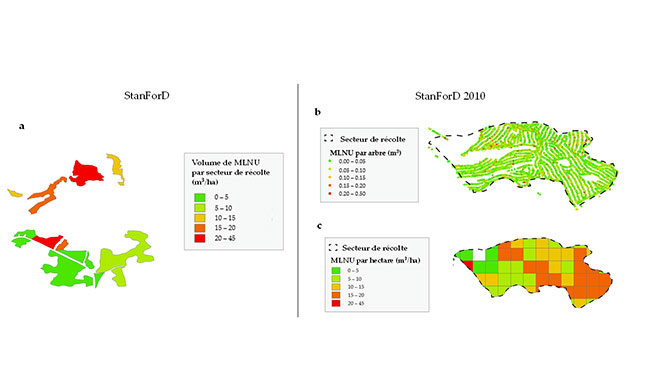
According to article 152 of the "Règlement sur l’aménagement durable des forêts du domaine de l’État" (RADF) (MFFP, 2018), the maximum volume of unused ligneous matter (MLNU) is 3.5 m3/ha for a total cutting and 1.0 m3/ha for partial cutting. However, in each region, the MLNU agreement made between the various forestry partners and the Ministry makes it possible to modify this maximum volume, by adding unwanted MLNU (MLNU-ND). This agreement comes with the obligation to carry out a field inventory, considered particularly costly by the forest industry. Considering the significant lack of technical manpower and the generally low profit margins of private companies, the general objective of the research was to estimate the volume of MLNU after mechanized harvesting operations using multi-purpose harvester on-board computers data to reduce the cost associated with conventional inventory.
The tool developed makes it possible to use production reports from StanForD (.pri) and StanForD 2010 (.hpr), GPS data and the outline of cutting sectors, in order to allow the localization of the volume of MLNU by cutting sector.
2019-2021
Developed by Rémy Huot and Alexandre Morneau
Between 2019 and 2021, several different prototypes were developed to read, process, aggregate and export content from different StanForD formats, both pre-2010 versions and StanForD2010 versions. These different tools have made it possible to automate the extraction of the desired information from the machines in order to produce specific reports or analysis. The expertise acquired in these developments has enabled us to include these capabilities in the FORAC ID IT platform.
2019-2020
Developed by Alexandre Morneau, Antoine Gariépy et Salif N'diaye,
in collaboration with CERFO and Philippe Bournival from MFFP.
The "Ministère des Forêts, de la Faune et des Parcs (MFFP)" has the mandate to develop and distribute knowledge products on Quebec forest ecosystems. It carries out a periodic inventory of the forests of the southern part of Quebec, which represents approximately 550,000 km2. This inventory is available in the form of an ecoforest map showing various characteristics describing the forest. The current mapping process relies on the interpretation of aerial photos by photo-interpreters. Photo-interpretation is a manual, slow and expensive activity.
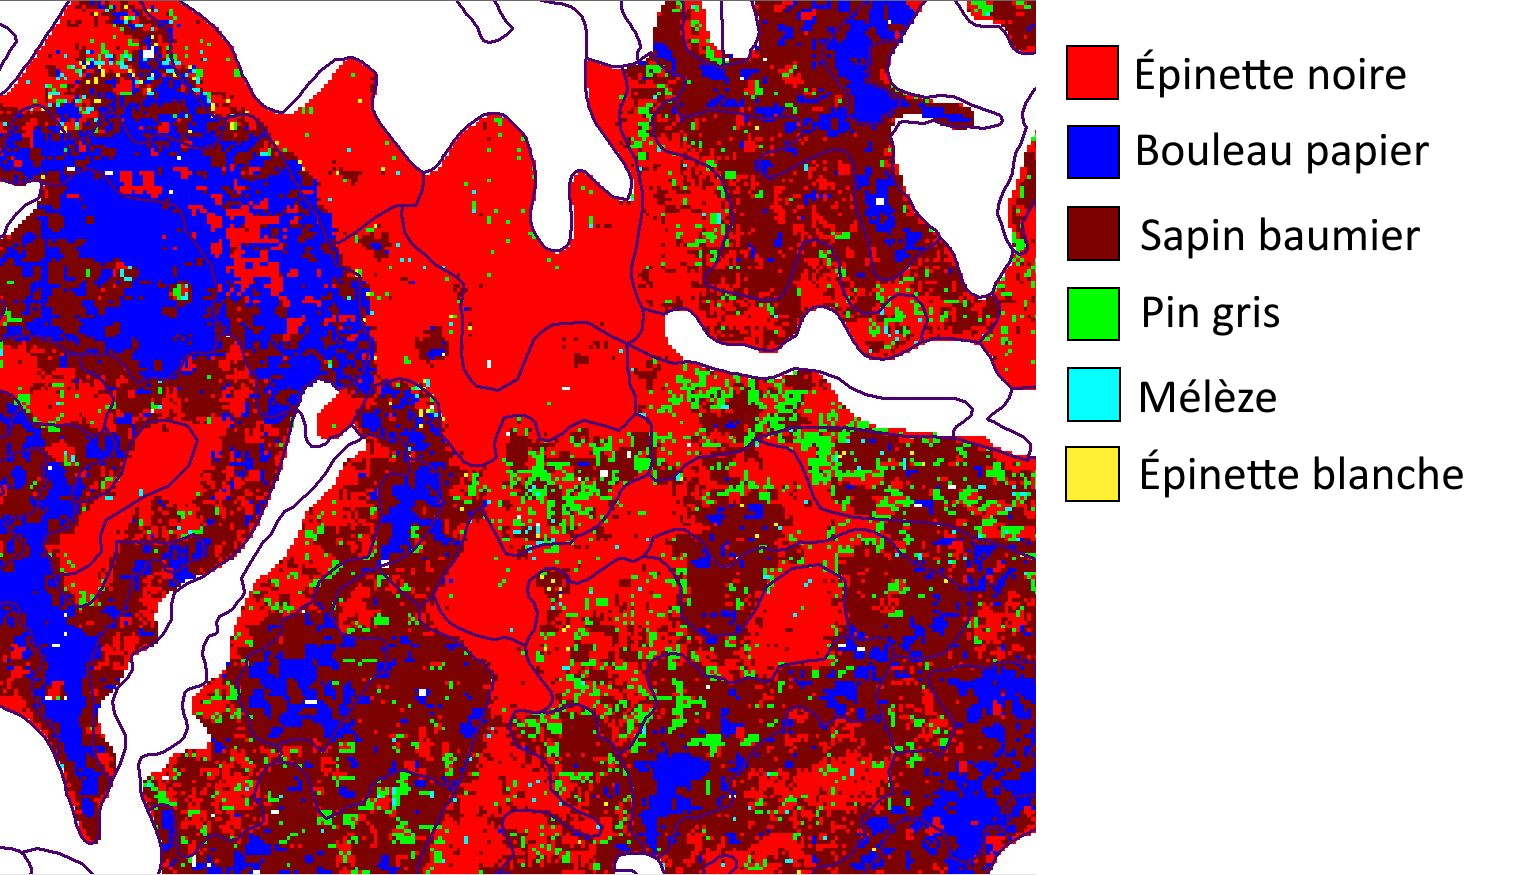
In 2019 and 2020, FORAC and CERFO, in collaboration with the MFFP, carried out a pilot project to explore the use of linear neural networks to identify tree species from satellite and aerial imagery. This project was intended to be a first step in a process aimed at exploring the potential of technologies based on neural networks in the process of photo-interpretation.
This first step was very beneficial on several levels. The journey made with FORAC and CERFO has greatly contributed to developing the expertise of the MFFP in the preparation of data sets for machine learning and in the automation of the latter. Together, we were able to address various issues such as spatial autocorrelation and active learning. The prototypes developed could reproducibly photo-interpret between 10 and 3000 km2 per hour depending on the spectral technology used. The results obtained were promising and allowed the continuation of research work which will eventually allow a more precise photo-interpretation than the current standard.
2021
Developed by Alexandre Morneau
in collaboration with Antoine Henry from FPInnovation.
The objectives of the project were to identify the species as well as estimate the relative humidity of wood logs photographed in a conveyor belt using neural networks. To achieve this, the goal of the model was to subdivides the images to be processed into thumbnails and attempts to label them as shown in the following conceptual illustration.
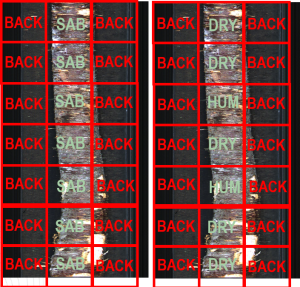
This project being confidential, the data, the code, the models and the results obtained cannot be shared without the explicit agreement of FPInnovation.
2021
Developed by Alexandre Morneau, Rémy Huot et Chaimaa Ghanmi,
in collaboration with Guillaume Cyr and Bruno Forest from BFEC.
The Canadian Forest Sector Carbon Budget Model (CBM-CFS3) was developed in 2005 to meet the forest carbon accounting needs of forest managers and analysts across Canada. Today, the "Bureau du forestier en chef'" (BFEC) uses the “Generic Carbon Budget Model (GCBM)”, a more recent and spatially explicit version of CBM-CFS3, to calculate carbon metrics associated with the calculation of allowable cuts. This is all done using spatially explicit simulation software that requires a lot of time. This project seeks to accelerate these calculations by estimating these metrics with metamodels developed by machine learning.
The main objectives of the project were to train machine learning models:
- to estimate the carbon balance between two consecutive forest strata
- to estimate the main carbon pools from the characteristics of a single forest strata
The work was carried out in collaboration with 2nd cycle FORAC intern Chaimaa Ghanmi. Over 460 experiments were carried out with different approaches such as polynomial regression, random forests and multilayer perceptron (MLP) neural networks. The best performing carbon balance and major carbon pools estimations models were MLP neural networks with coefficients of determination (R-squared) of 0.87 and 0.90, respectively. In addition to the trained models, the methodology used has been documented and delivered, with all the source code necessary to train new models.
The technology transfer with BFEC was successfully completed. The models provided are now integrated with the FMT forest planning platform and they currently use technology developed at FORAC to manage the continuous improvement of the models as recommended in MLOps practices.
2007
The Excel tool for operations management has been developed on the request of SME. This tool allows a better follow up of the production operation time. The information can be sorted by production number, date, employee’s name or simply by operation. The tools also include performance indicators covering a limited period of time to simplify the user interface.
Based on the principle that nothing can be improved unless it has been measured, the Excel tool for operations management was developed to help businesses improve evaluation of their operating times. Production time data are very useful in operations planning, operation chain balancing, project profitability, and manufacturing cost implementation. The tool helps to define non-value added operations and those that could be improved.
As needed, the Excel tool for operations management can be used to manage the whole production system or specific projects.
[French] User guide - Gestion des opérations (pdf, 532 Kb)
[French] Excel tool - Gestion des opérations (xls, 256 Kb)
* The document requires the use of macros. To activate macros, select “tools” in the top menu, then “macros” then “security”. The recommended security setting is “medium”. Open the document and then click on “activate macros” while the document is opening.
2007
This Excel tool was developed for helping cabinet makers to manage their procurement, but can be used for any manufacturer who wants to better control it. Using a data table, it allows a company to manage its purchases by supplier, by project, and/or delivery date.
Managing procurement by supplier
Managing by supplier allows the buyer to manage the products list and their associated prices previously negotiated with each supplier. Moreover, the history of the purchased products and prices paid are available by supplier. It is possible, for example, to know, for each supplier, the value and quantity of annual purchases.
Managing procurement by project
Managing your purchases by project makes it possible to control quantities and costs of raw materials consumed all along a project. Analyzing your cost by project and doing “Post Mortems” thus becomes easier.
Managing procurement by delivery date
Managing your purchases by delivery date simplifies follow-ups with suppliers when reception dates are not respected. A good follow-up with suppliers allows for a better production planning.
The following links presents how to use the tool and the Excel tool.
User guide for the excel file [in french] (pdf, 286 Kb)
Excel file - procurement management [in french] (xls, 601 Kb)
* The document requires the use of macros. To activate macros, select “tools” in the top menu, then “macros” then “security”. The recommended security setting is “medium”. Open the document and then click on “activate macros” while the document is opening.
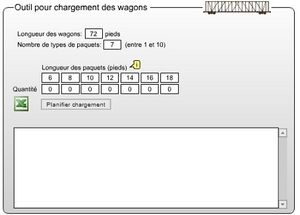 The tool is made for the loading of a rail car with softwood of various dimensions. When a load contains products of the same quality, thickness and width, but different lengths, loading becomes more complicated.
This tool allows planners to quickly calculate the optimal load of bundles when lengths are different. The objective is to maximise the space used in the car, so that it is filled to capacity.
Using the tool
- Indicate the length of the car. The bundles will be loaded to fill the car as much as possible.
- Indicate the number of bundles. For example, you could say that you have seven bundles of different lengths.
- For each separate bundle, indicate its length and the number of bundles of this length to load. You need to indicate lengths in ascending order.
- Click on the button “Plan load” to start the planning tool.
Reading the results
Each line represents the maximum load for each row in the rail car. Therefore, you will know the number of bundles to place in each row in function of their length. The column "Total" represents the length used by the bundles in the row.
Download the Excel version of the tool (xls, 158 Kb)
 This formation introduces the concepts required for the evaluation and quality control of forest management activities. It focuses on basic elements of sampling theory and implementation of statistical compilations necessary for silvicultural prescriptions, monitoring interventions and follow-up after intervention. The references used in this training are inspired by the information needs related to activities in public forests. However, it is important to note that the principles presented are universal and that they can be implemented in different contexts and fields of expertise.
Goal
Understand the basic principles of sampling and estimation to apply them judiciously when situation demands.
More specifically, this training has the following objectives:
- Implement the sampling concepts for the realization of a sampling plan;
- Justify the choice of the type of observation point (plot size);
- Justify the number of plots to carry out (to calculate the sample size);
- Use statistics to evaluate the reliability of results;
- Know the limits of estimating rare events;
- Compare 2 samples.
Target audience
Foresters and professional engineers responsible for sampling for inventory of interventions and for monitoring of forest interventions.
Managers and plant managers, sales managers, responsible for production planning at the tactical and operational level.
Statistique appliquée à la foresterie [in French only] (pdf, 2.38 Mb)